Air pollution in rural areas & home ventilation automation
January 1, 2021 | by Radoslav Paučo

We breathe polluted air and we are not even thinking about it. We make our lives and lives of our neighbours shorter. Statistically.
When you hear about air pollution you usually think of big cities, industrial areas, coal burning power stations, large diesel-guzzling trucks or traffic jams. Not rural areas. But in central Europe, rural areas, villages, and little towns are the most polluted places. I can be very specific because this hits close to home for me. The picturesque village where my parents live has a problem. And part of that problem is that this problem is invisible. But you can smell it.
The main source of air pollution in my parents’ village comes from heating of individual households. Making things super simple, the air pollution is caused by burning wood, coal, wooden products, garbage, and god knows what, often in archaic stoves and furnaces. I will call this low quality fuel simply wood from now on. This combined with geography – you bet that picturesque villages lies in basins surrounded by hills – and winter weather patterns leads to many smog-alert days during the heating season. And coughing.

Keeping things simple, fine dust particles – with diameters lesser than 10 microns (PM10), or even lesser than 2.5 microns (PM2.5) – are the pollution, the invisible killer. In rural areas such as my parents’ village, these micro particles are almost completely produced by households burning wood for heating. According to European Environmental Agency (EEA), there were 379 000 premature deaths attributed to PM2.5 pollution in EU27 and UK in 2018. It is estimated that average life expectancy in EU is 8.6 months lower than it would otherwise be, due to PM exposures from human sources. The World Health Organization (WHO) provides evidence of links between exposure to air pollution and type 2 diabetes, obesity, systemic inflammation, Alzheimer’s disease and dementia. The International Agency for Research on Cancer has classified air pollution, in particular PM2.5, as a leading cause of cancer. Other significant diseases attributed to air pollution and leading to deaths, identified by WHO, include stroke, chronic obstructive pulmonary disease, and lower respiratory infections.
PM2.5 particles are our main concern here and the biggest threat for health. The background concentration of these particles, i.e. naturally present in the air if you take away all humanly produced pollution, is about 2.5 micrograms (μg) per cubic meter, according to EEA. Following the WHO guidelines, the mean annual outdoor concentration of PM2.5 particles should not exceed 10 μg per cubic meter and even a single day of breathing of polluted air with PM2.5 concentrations over 25 μg per cubic meter means health risk. Part of the problem could be that people actually don’t know the PM2.5 concentrations they are producing and breathing, so they are not concerned. But actually, at least this part of the problem has a simple solution.
Sensor community
Meet sensor.community, also known as Luftdaten project. It is a worldwide network where you can register your fine particle sensor and share in real-time its data with everyone in the world. The sensor.community also provides “hardware standard” for building of your own low cost dust particle sensor, firmware for the sensor and application programming interface (API) through which you can access PM and meteorological data of any sensor in the network. Neat!
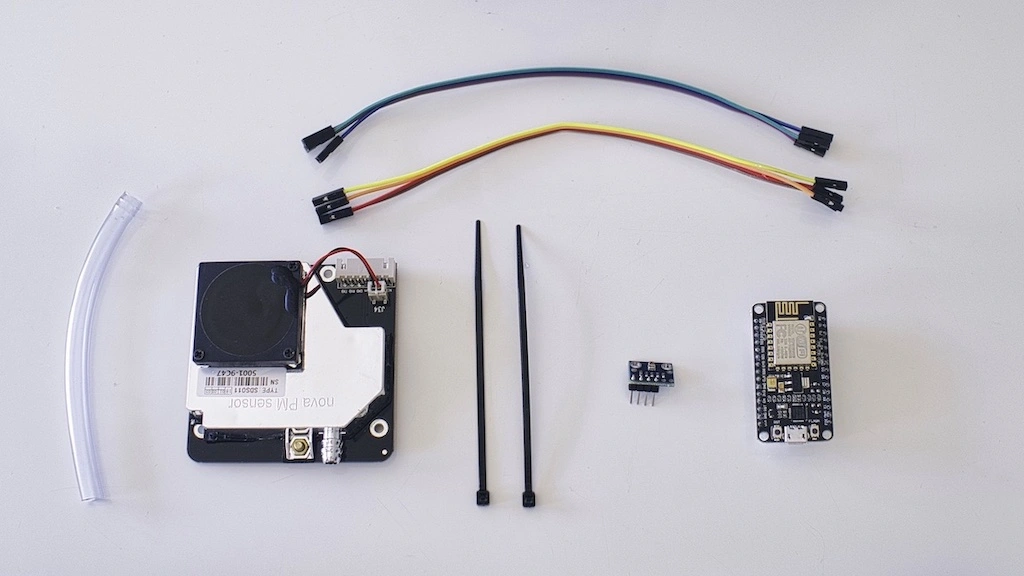
Building your own detector with the sensor.community recipe is quite simple. You can even buy DIY packages with all necessary components and preflashed boards (firmware already installed), e.g. here (simple version) or here (equipped with a heating chamber to eliminate the effect of water droplets condensation). In our station we are using the components and firmware developed by the Polish community & Nettigo. If you buy the kits from Nettigo, you can find detailed step by step instructions on how to build and connect your air quality monitor to the sensor.community network here (some articles are in Polish, but you can use Google translator). So for around 50 euros, you can build your own air quality sensor and start to monitor the air in your neighbourhood or you can access data from 13 000+ existing sensors around the world for free. We will talk about sensor.community API in a bit.
The main hardware components of the sensor.community air quality monitor are:
- SDS011 – fine particle sensor based on laser beam scattering,
- BME280 – temperature, pressure & humidity sensor,
- WiFi module based on ESP8266 microchip – the brains – an IOT board.
The accuracy of SDS011 was proven to be sufficient by comparing its measurements with professional air quality monitoring devices in real life conditions, see e.g. here.
What can you do with your data?
You have several options what you can do with the data produced by your sensors. For starters you should send them to the Luftdaten API. After registering your device, this is as simple as checking the radio box in the firmware graphical user interface (GUI). The map of the sensors in the network can be seen here. You can drill down to a specific station and view it’s current readings. Now you are part of the community, you are on the map! Other useful services where you can send your data and visualise them are:
- madavi.de – Grafana visualisation layer for the Luftdaten API. Just change chipID=esp8266-4844767 part of the query string with your sensor UID to visualise data from your sensor. You can find your sensor UID in your account details here and originally in your sensor GUI which is accessible if you are on the same network as your sensor. You can check your router GUI to get the IP address of your sensor. Again, to send the data to the madavi service is as simple as checking the radio button in the firmware GUI of your sensor.
- aqi.eco – air quality dashboard. This is very nice service if you want to count smog-alert days, show current or daily averaged air quality situation on large screens and thanks to responsive design even on the screen of your phone. You can also show data from all your sensors in one screen or inspect meteorological data measured by your sensor. You can check the whole world map of sensors here and drill down to the station of your interest. To register your account for the service click here. Don’t forget to check “Send data to own API” option in your sensor’s firmware GUI and to provide API details you can find under device details in your aqi.eco web console.
- Feinstaub-App – a mobile app with nice feature of smog alerts. How to connect is detailed here. Don’t forget to check “Send to Feinstaub-App” option in your sensor’s firmware GUI.
- OpenSenseMap – yet another map of sensors with nice UI. Don’t forget to check “Send to OpenSenseMap” option in your sensor’s firmware GUI and to provide the senseBox-ID you get when you link your sensor with your OpenSenseMap account. You can register here.
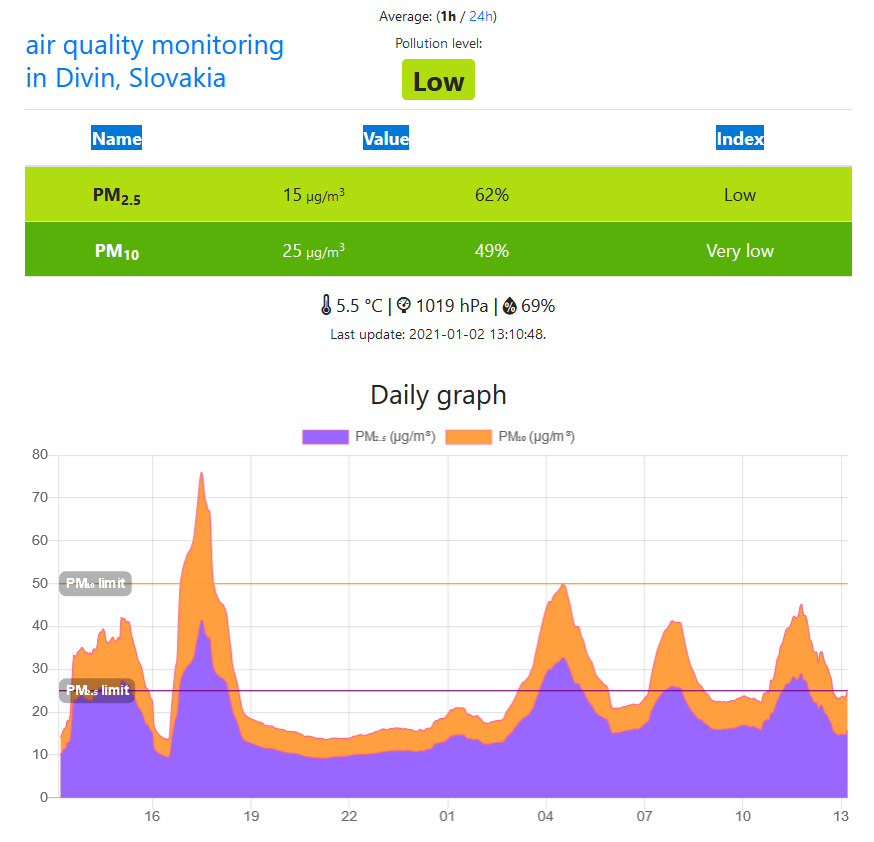
Example of how aqi.eco service visualises your sensor data.
Luftdaten API
The Luftdaten data are open. You can request data from yours or any other sensor in the network and use them in your automation projects. The API documentation is detailed here. For example, you can send a simple GET request
GET https://data.sensor.community/airrohr/v1/sensor/52525/
which responded with the following JSON
[
    {
        "timestamp": "2021-01-02 12:57:43",
        "sensordatavalues": [
            {
                "value_type": "P1",
                "id": 7067853585,
                "value": "20.85"
            },
            {
                "value_type": "P2",
                "id": 7067853588,
                "value": "13.50"
            }
        ],
        "sensor": {
            "pin": "1",
            "sensor_type": {
                "name": "SDS011",
                "id": 14,
                "manufacturer": "Nova Fitness"
            },
            "id": 52524
        },
        "location": {
            "indoor": 0,
            "latitude": "48.45221739811",
            "altitude": "295.6",
            "id": 38432,
            "country": "SK",
            "longitude": "19.52619194984",
            "exact_location": 1
        },
        "sampling_rate": null,
        "id": 3260644658
    },
    {
        "timestamp": "2021-01-02 12:55:14",
        "sensordatavalues": [
            {
                "value_type": "P1",
                "id": 7067800135,
                "value": "22.50"
            },
            {
                "value_type": "P2",
                "id": 7067800136,
                "value": "14.85"
            }
        ],
        "sensor": {
            "pin": "1",
            "sensor_type": {
                "name": "SDS011",
                "id": 14,
                "manufacturer": "Nova Fitness"
            },
            "id": 52524
        },
        "location": {
            "indoor": 0,
            "latitude": "48.45221739811",
            "altitude": "295.6",
            "id": 38432,
            "country": "SK",
            "longitude": "19.52619194984",
            "exact_location": 1
        },
        "sampling_rate": null,
        "id": 3260620248
    }
]
This gives you a list of all readings from the given sensor from the last 5 minutes interval as well as some details on sensor location, type, etc. The last part of the endpoint is the sensor’s UID, check your sensor.community account for yours. Typically, all your physical sensors have its own UID. In our case 52524 is the PM sensor reporting PM2.5 and PM10 values and 52525 is the meteorological sensor reporting temperature, humidity, and atmospheric pressure.
Home ventilation automation
How can you ventilate your house when the air outside is heavily polluted most of the day? You have to wait for time windows when conditions outside are suddenly better. But how to make sure you don’t miss it? The simplest hack is to setup alerts in The Particulate Matter App linked to the sensor of your choice. But if you have some electrical ventilation device installed in your home you can make it intelligent to ventilate the house only when the air outside is sufficiently clean.
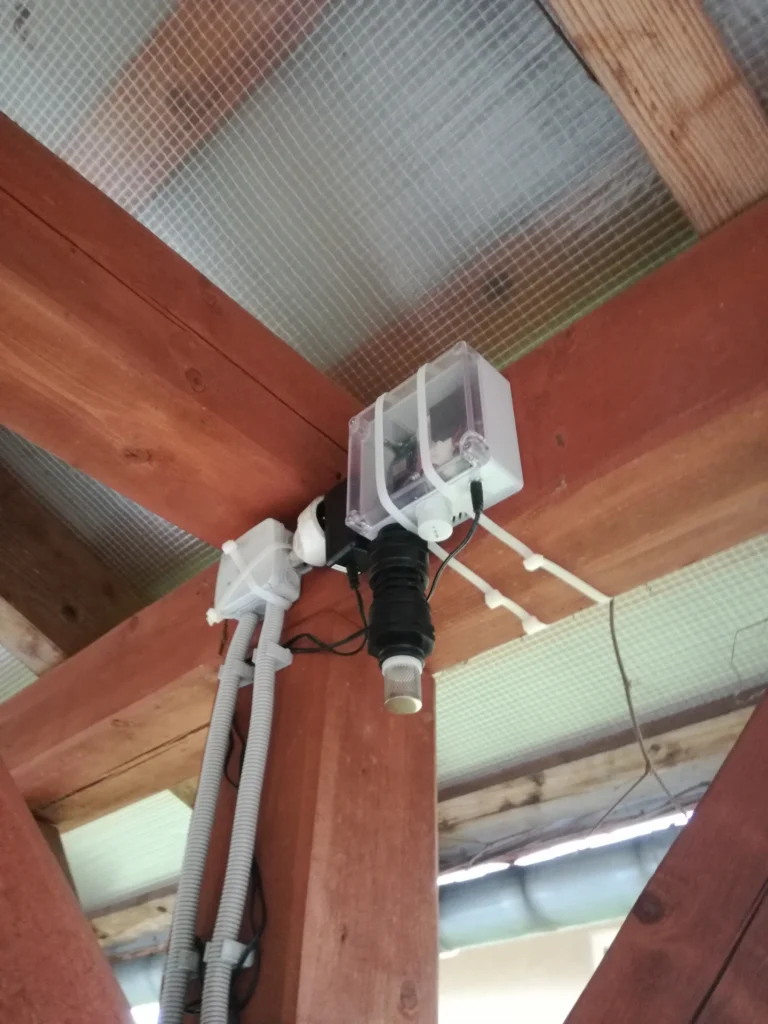
From the hardware point of view, we need:
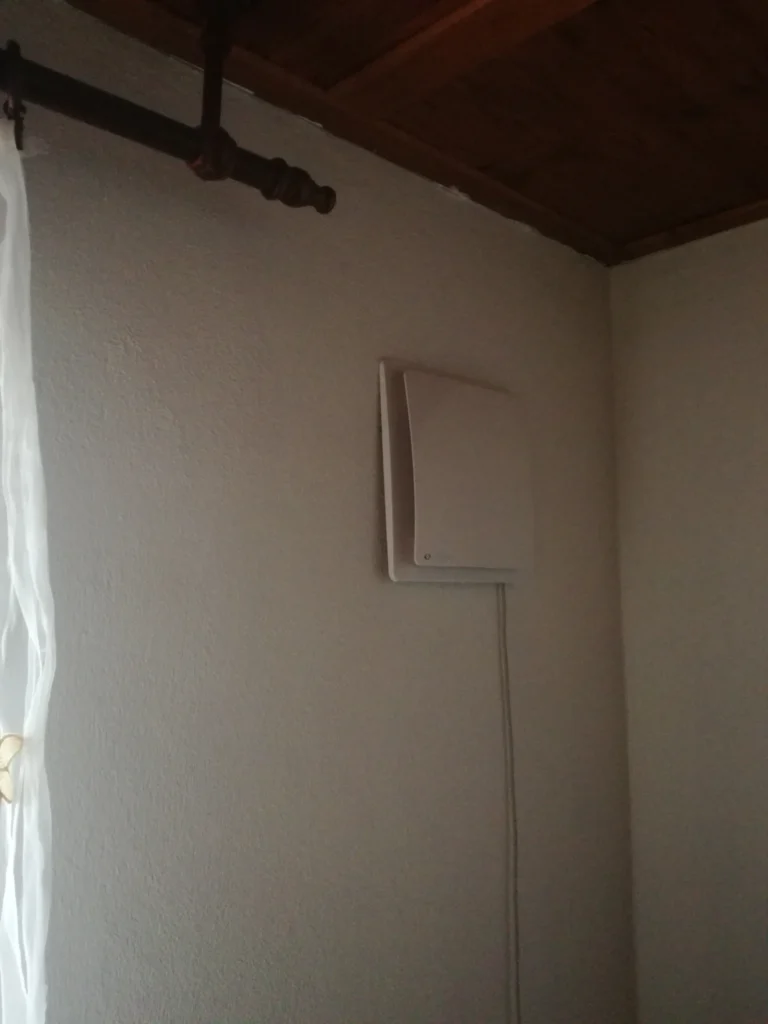
- outdoor air quality monitor – we are using this one
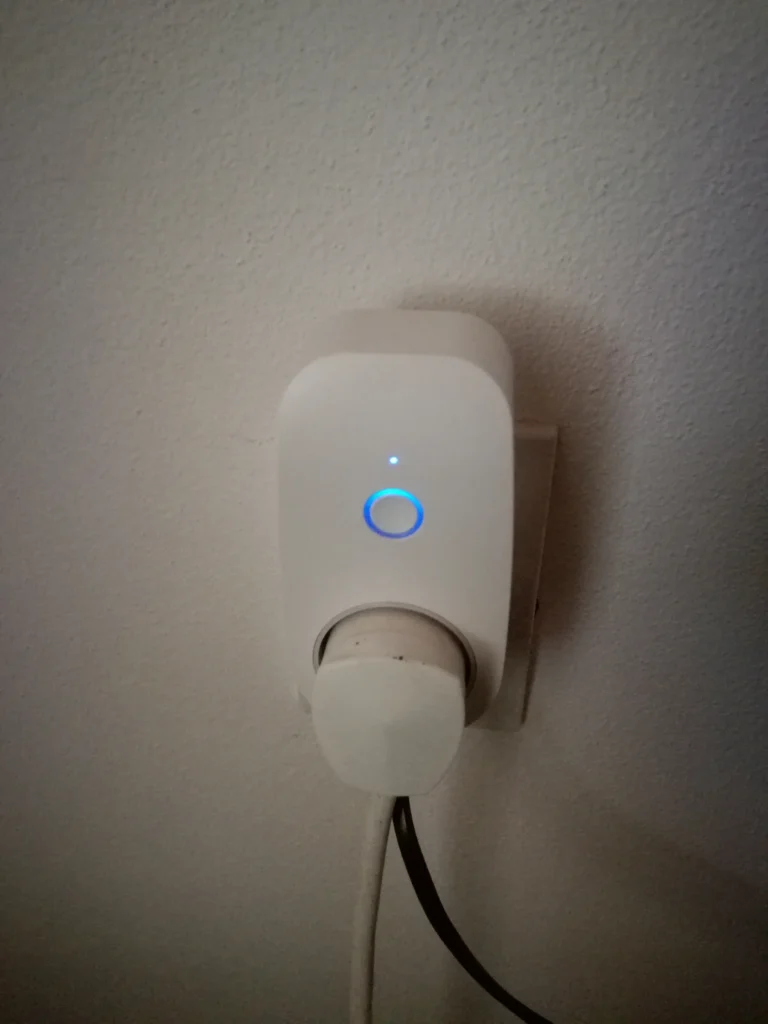
- smart electric socket – we are using IQTech/Swiss+one SH1100
- indoor air quality monitor (optional) – we are using this one
For the outdoor pm monitor, we have chosen the one with the heating chamber to eliminate the effect of condensation. In the case of relative humidity over 70%, water and dust particles combine making more and bigger objects. Optical sensors as ours could return readings few times higher than the real ones when the condensation phenomenon is present. Actually, you would not need your own sensor at all if some of your close neighbors has one. Luftdaten data are open and accessible for everyone in the world. The indoor air quality monitor is completely optional, but it is interesting to see the indoor air quality, its time evolution, dependence on the outdoor air quality, indoor activities, and so on. So it gives you more options for experimentation and you can get some valuable insights. Lastly, we need a device that will switch our ventilation on and off at proper time. We have chosen a smart socket for its simplicity. Just make sure that you buy one that you can actually automate, ideally look for open APIs or at least IFTTT support.
From the software-infrastructure point of view in our case, we need:
- Briliant Smart application paired with the smart socket, the app is free
- IFTTT account, free version is sufficient for this project
- AWS account, free tier is sufficient for this project, but you need to link your credit card with your account
At the time of writing of this post, we were able to operate the whole solution with these services for free.
IFTTT setup
If This Then That – IFTTT – is a web-based service that allows users to create chains of conditional statements triggered by changes that occur within other web services. Our chain in this case is that some periodically running code that is checking our PM data create either turn-off or turn-on event and based on the type of the event the smart socket receives either turn-on or turn-off command. Of course, the turn-on event coming to the socket that is already turned on does nothing and the same holds for the turn-off event coming to the socket that is already turned off. But why on Earth we need this IFTTT, can’t we just send a request “directly” to the smart socket? No, we can’t. The smart sockets usually do not have open APIs. But some of them do support IFTTT.
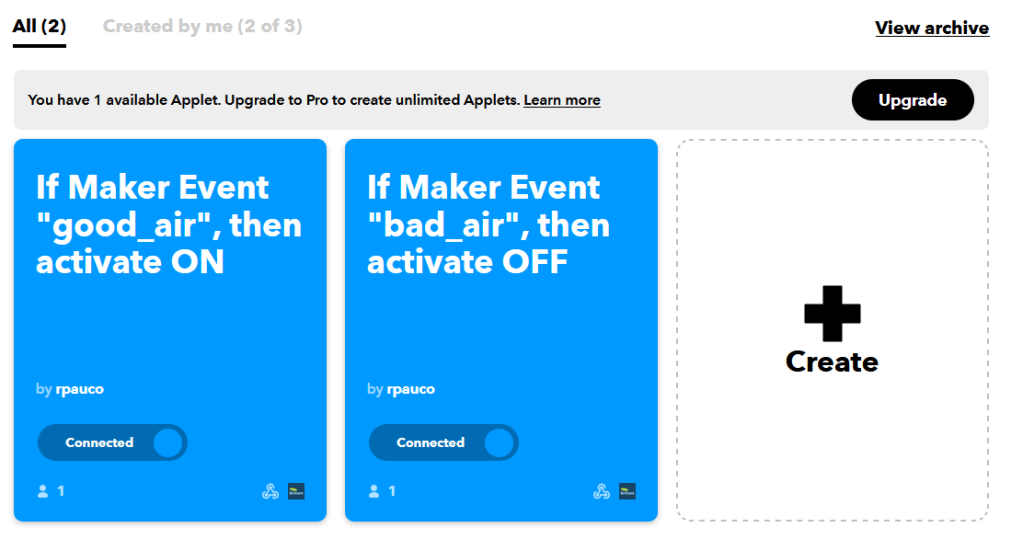
We can start by creating an applet for turning off of the smart socket here. At the time of writing of this post you could have created up to 3 applets for free on IFTTT platform. We need 2, one for turning on and one for turning off of the ventilation. The UI is fairly intuitive, click on “If This”, choose “Webhook” as an option, fill in the event name, e.g. “bad_air” and hit the create button. The “If This” part is created. Under “My services” in your account menu, you can now see the “Webhook”. By clicking on “Documentation” you can see the actual endpoint you should call when you want to trigger the “Than That” part. You can also check the activity log, i.e. check when was your webhook actually called. So to trigger the bad_air event you simply create a following request:
GET https://maker.ifttt.com/trigger/bad_air/with/key/{your_key}The {your_key} part is provided in the Documentation.
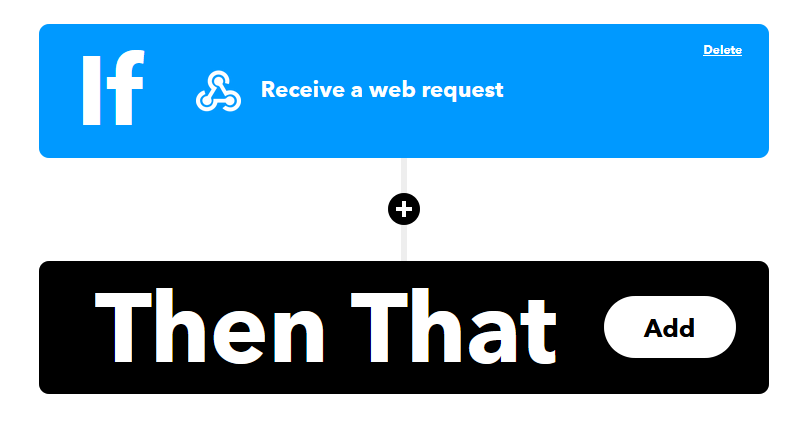
Let’s continue with “Then That” part. So when you receive a request on your turn-off webhook you want to actually turn off the smart plug – the ventilation stops. Here you can use integration between IFTTT and your smart app. We are using Brilliant Smart android app. If you have already created an account for Brilliant Smart you are almost ready to integrate. But first open the app and make sure you paired the app with your smart socket. Then create a scene for turning off of the socket, just click through it, should be fairly intuitive. Now back to IFTTT, click “Then That” and type “Brilliant Smart” and choose it, then click “Activate Scene” and “Connect”. The prompt for logging to Brilliant Smart will pop up, log in. Finally, choose the scene you created for turning off of the socket. Your applet is created. But for now nothing is happening as you are still missing the brains – the program that will be requesting the Luftdaten API for PM data, bearing some logic for turn-off or turn-on event invocation and actually pinging your IFTTT webhook. In close analogy with what we did so far, you can also create the second applet that will turning the ventilation on.
Code
Let’s start with specification of what we want our automation brain to be doing:
- make GET request to Luftdaten API and parse the response to get current PM2.5 and PM10 readings from our sensor
- according to the PM data from last 5 minutes decide whether to send turn-off or turn-on signal for ventilation
Our detailed python code can be found here. If all PM2.5 readings from last 5 minutes are higher than 8.5 μg/m3 or all PM10 readings from last 5 minutes are higher than 17 μg/m3 send turn-off signal, i.e. send GET request on our “Turn-off” IFTTT webhook. On the other hand, if allPM2.5 readings from last 5 minutes are lower than 5.0 μg/m3 and also all PM10 readings from last 5 minutes are lower than 10.0 μg/m3 then send turn-on signal, i.e. send GET request on our “Turn-on” IFTTT webhook. You have to experiment a bit with the threshold values to find optimal values with which you can ventilate at some time windows but at the same time you don’t want to degrade your indoor air quality. Indoor monitor can help here.
Last thing to do is to host this code somewhere to be able to run it, say every 3 minutes, for 24/7. We will host the code with the serverless compute service AWS Lambda and schedule it with Amazon CloudWatch event rules.
AWS setup
Log in to your AWS account and go to AWS Lambda home. In the upper right corner choose the desired geographical region and click on “Create function”. Choose “Author from scratch”, fill in the name for the function and choose “Python 3.8” for Runtime and hit “Create function” again. Now, navigate to your newly created function and fill in the code. You can use the code we provided, or you can use your own, just adhere to the following structure:
import urllib3
import json
import logging
def lambda_handler(event, context):
** YOUR CODE HERE **
return {
'statusCode': 200,
'body': json.dumps('All good!')
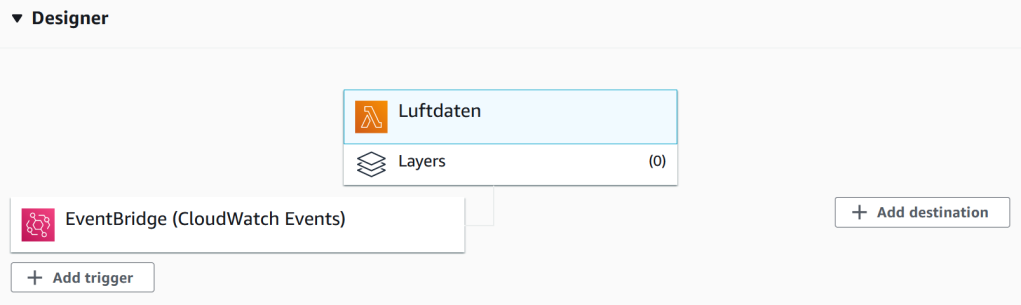
}Finally, click on “Deploy”. Your function is now deployed and is ready to be run in the cloud. We just need to add scheduling. In your AWS console, navigate to CloudWatch. Make sure you have chosen the same geographical region as you have chosen for your Lambda function, check in the upper left corner. In the left CloudWatch menu go to Events -> Rules -> Create rule. Here, choose “Schedule” radio button, and provide either CRON expression or fixed rate at which should be your Lambda function triggered. We have chosen the fixed rate of 3 minutes. Add target, choose “Lambda function” and choose your function. Finish the rule creation with providing a name for the rule. Your Lambda function scheme in the Designer tab should look like this now:
You can verify that your Lambda function is running by going to “Monitoring” tab and there clicking on “View logs in CloudWatch” what redirects you to logs created by your lambda function and managed by the CloudWatch service. We are done. Your ventilation is now automated providing you with clean air when possible.
Oh, and to be 100% safe from unexpected spending on cloud computing, create a billing alarm on AWS. With this setup you should be charged nothing, everything should be covered by the always free tier (if this is your only AWS project). You can check AWS Lambda pricing here and Amazon CloudWatch pricing here.
I have also experimented with having two lambda functions, one for turning on and the other one for turning off of the ventilation. This way you can have two different schedules for ON – triggered not so often say every 30 minutes – and for OFF – triggered say every 3 minutes to prevent indoor contamination in case of sudden air quality worsening. With this setup you can prevent frequent ON-OFF switches when air quality outside is rapidly fluctuating.

Post scriptum
The biggest challenge and the most important thing in the clean-air pursuit is to convince your fellow citizens to think about how they heat their homes and how is this interconnected with what they are breathing. We have to use different channels for this. Maybe I will write a post about more psychological and sociological topics next time.
RELATED POSTS
View all


Leave a Reply